A patent has few or many backward citations, either cited by the applicant or the patent examiner. As forward citations emerge over a period of time, a chain is created linking several citations to one another. Now, this chain is not unidirectional, and can have numerous links. These connections can quickly become complex to track and analyze.
Click to enlarge
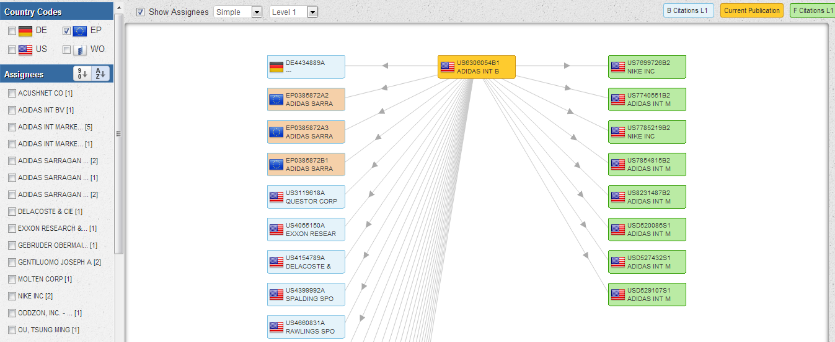
In Relecura, you can view an interactive citation map for single patents, to help analyze their citation networks. We are working on extending this visualization for groups of patents as well.
As an example consider this patent granted to Adidas Int BV (US6306054B1) for a specific technique to manufacture footballs. If you look at the Citations Map for this, it provides a list of forward and backward citations along with the assignees. A notable forward citing assignee would be Nike Inc. (US7785219B2) in this case.
You can further analyze the network by highlighting patents from a specific geography. Selecting European Patent Office (EP) will highlight patents held by Adidas Sarragan France. In a way, this provides a clearer view of citations that you’d like to focus on. Similarly, you can highlight specific Assignees as well. Multi colored arrows clearly distinguish backward citations from forward ones and are particularly helpful when you are studying a large mesh of citations.
Click to enlarge
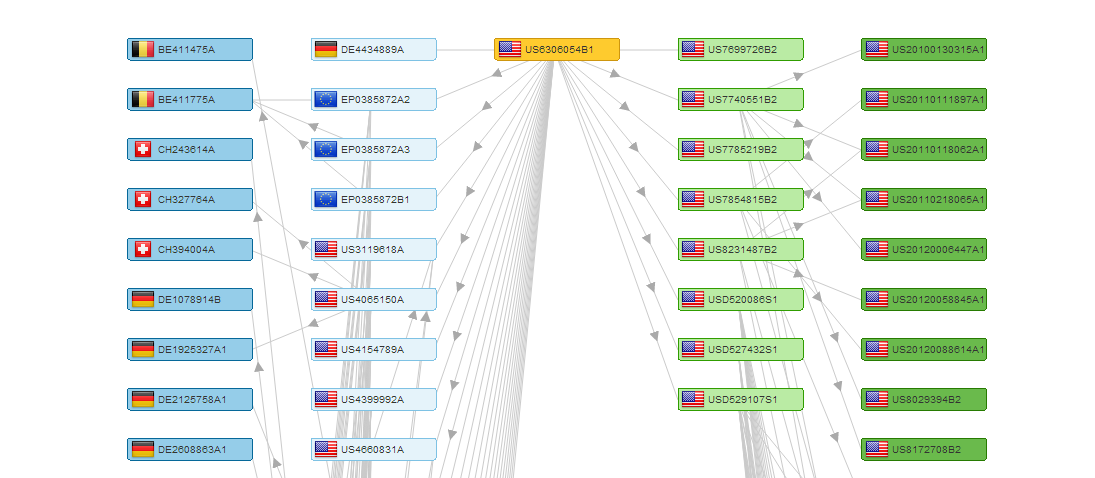
The visualization enables the display of the second-level of citations as well, i.e. the forward citations of the first level of forwards and the backward citations of the first level of backwards. This provides a wider view of the chain of citations.
For the same example mentioned above, a second level map throws up companies such as Puma, Wilson, and Tachikara, having
patents addressing similar inventions. Interestingly, it also displays a company named Infomotions Sports Technology Inc. who have taken this ahead in a slightly different application area. Their patent (US20120058845A1) talks about a method of integrating electronic components in sport balls.
Another view of this map that you could use is plotting citations on a timeline (as in the example below). This provides a snapshot of how these connections emerged over a period of time. This view can provide a sense of the age of various citations.

Click to enlarge
As is well understood, connections among citations hold a lot of information that can yield strategic business intelligence. Citation analysis can help to in getting clues about competitor activity (both existing and emerging), and generate IP commercialization leads. Additionally, interactive visualizations help in slicing the citation data appropriately to simplify such analyses.
Please share your ideas on the importance of citation networks and the methods you use to analyze them.


One thought on “Lost in citations?”-
Pingback: Lost in (patent) citations? | Competitive Intel...
Comments are closed.