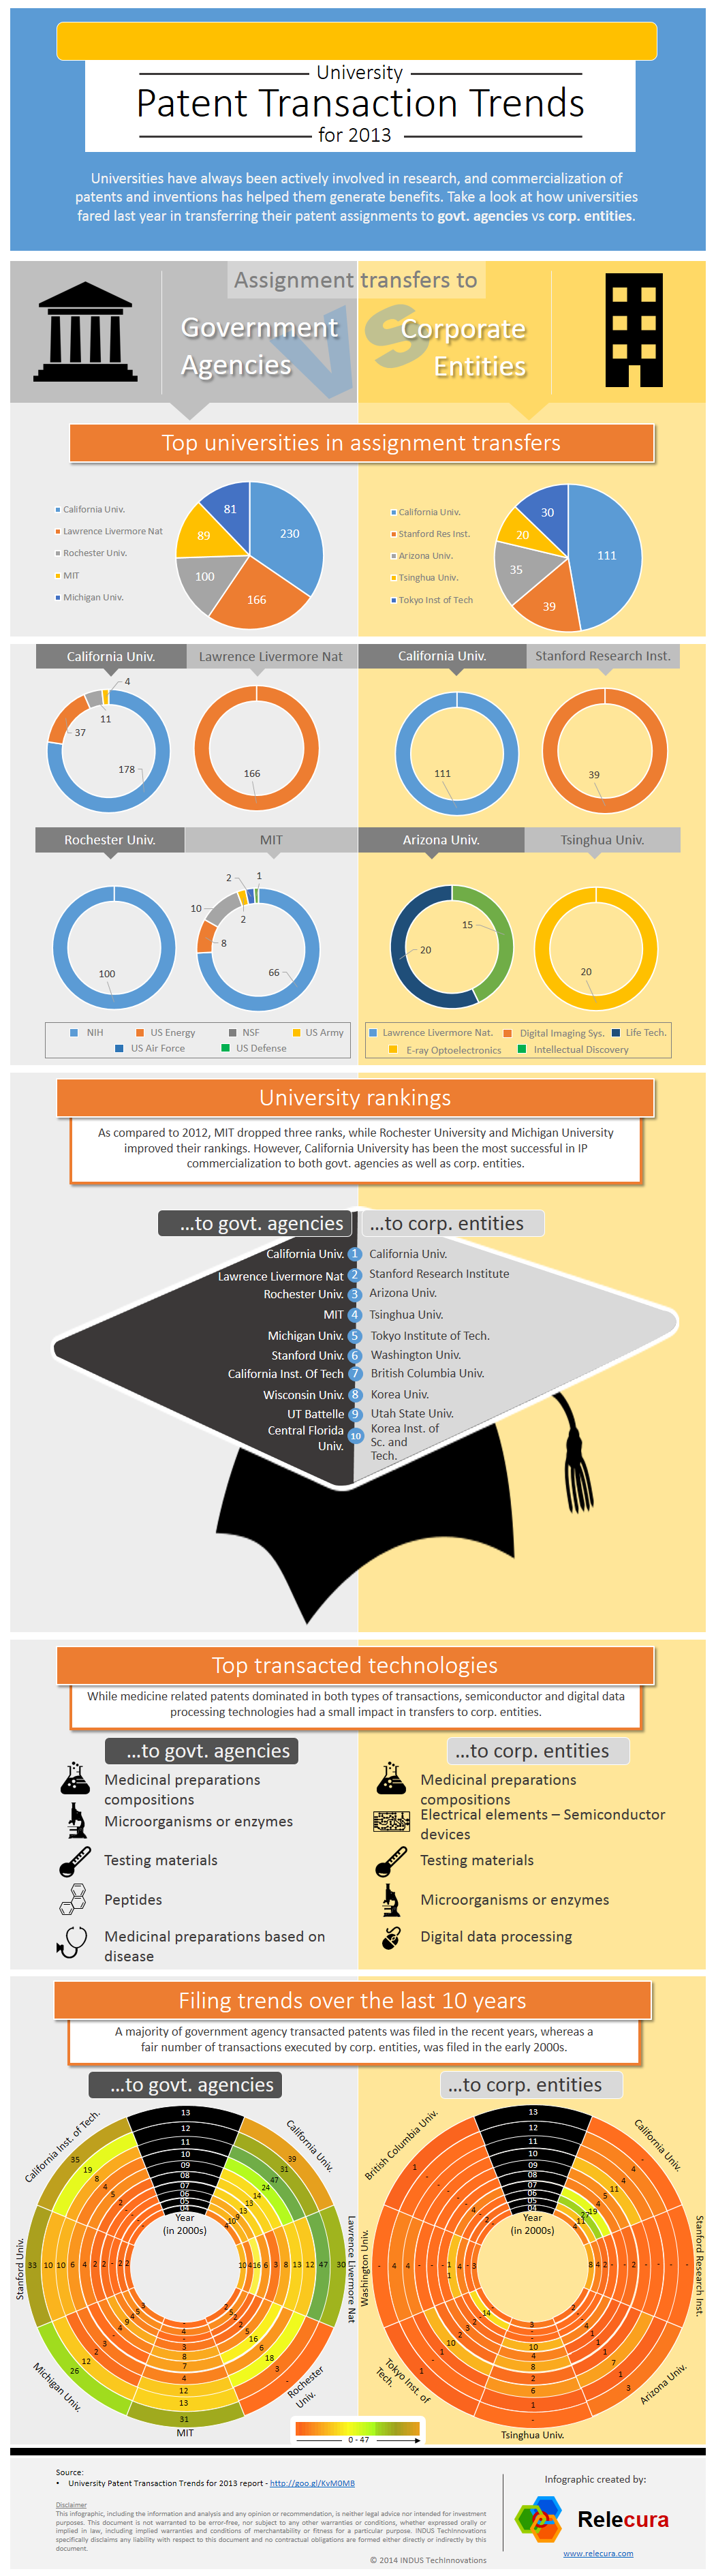
In this infographic, we have analyzed the university patent transactions and their overall impact. We have outlined some interesting trends such as top transacted technologies, university rankings, and filing trends over the years. In addition, data points from 2012 provide a notable comparison of how the universities stack up as compared to previous year. For a detailed analysis, we have segregated the report into two major chunks, studying transactions to government agencies and corporate entities respectively.


One thought on “[Infographic] University patent transaction trends for 2013”-
Pingback: University patent transaction trends for 2013 | Produção Industrial
Comments are closed.